


Think draft spot is just a number?
It’s not. The draft slot is the clearest hint about how much a rookie will actually play.
From 2016–2023 snap data the pattern is sharp: top-five picks average about 78% of offensive snaps, second-rounders near 32%, Day 3 picks around 12%.
So draft position is the best single predictor of rookie snaps.
Use slot-based ranges to make quick projections, then adjust for team need, scheme fit, and injuries.
Draft Slot Correlation With Rookie Snap Counts
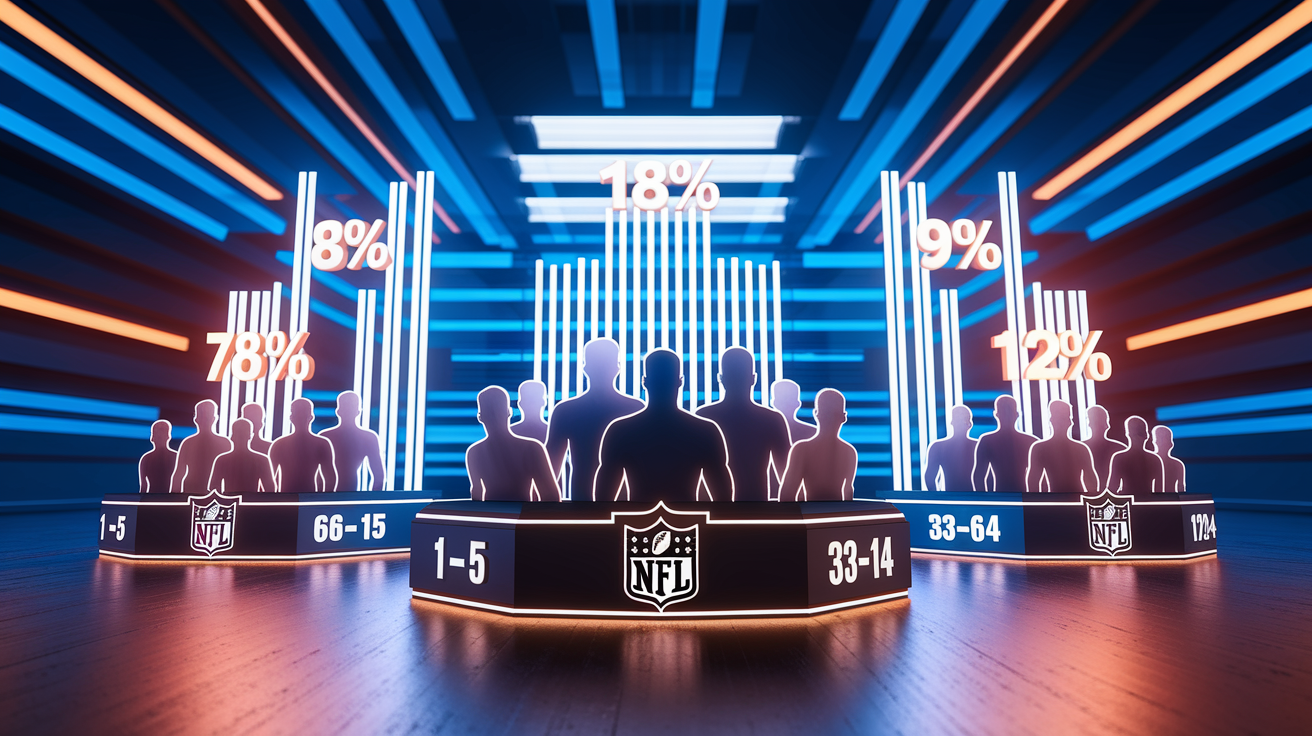
Draft position is still the best single predictor of how much a rookie will actually play. Looking at snap data from 2016 through 2023, the pattern’s pretty clear: earlier pick, more snaps. Top five guys average around 78% of their team’s offensive snaps as rookies. Second rounders? About 32%. Day 3 picks sit closer to 12%.
This holds across all offensive positions, though how fast it drops off varies a bit. First rounders get both trust and a roster built around the idea they’ll contribute now. Teams spend big draft capital expecting quick returns, and the snap counts show it. Each tier has real variation, usually 10 to 18 percentage points depending on where exactly you’re picked, which leaves space for outliers. Guys who fit the scheme perfectly, guys who benefit from injuries, guys who just weren’t ready.
The numbers don’t bounce around much year to year either. Over eight seasons and more than 2,500 drafted rookies, the average snap percentages by round have barely moved, maybe five points in either direction. Positional stuff accounts for most of the shifts. Teams keep prioritizing early picks as the way to get immediate impact, and rookie usage reflects that behavior with surprising consistency.
| Draft Range | Average Rookie Snap % | Typical Role |
|---|---|---|
| Picks 1–5 | ~78% | Immediate starter, cornerstone role |
| Picks 6–15 | ~68% | Week 1 starter or heavy rotation |
| Picks 16–32 | ~54% | Rotational starter, situational use |
| Round 2 (33–64) | ~32% | Rotation/package role, gradual integration |
| Round 3 (65–96) | ~24% | Specialist or developmental depth |
| Rounds 4–7 (97+) | ~12% | Special teams, limited offensive snaps |
Snap Expectations by Offensive Position
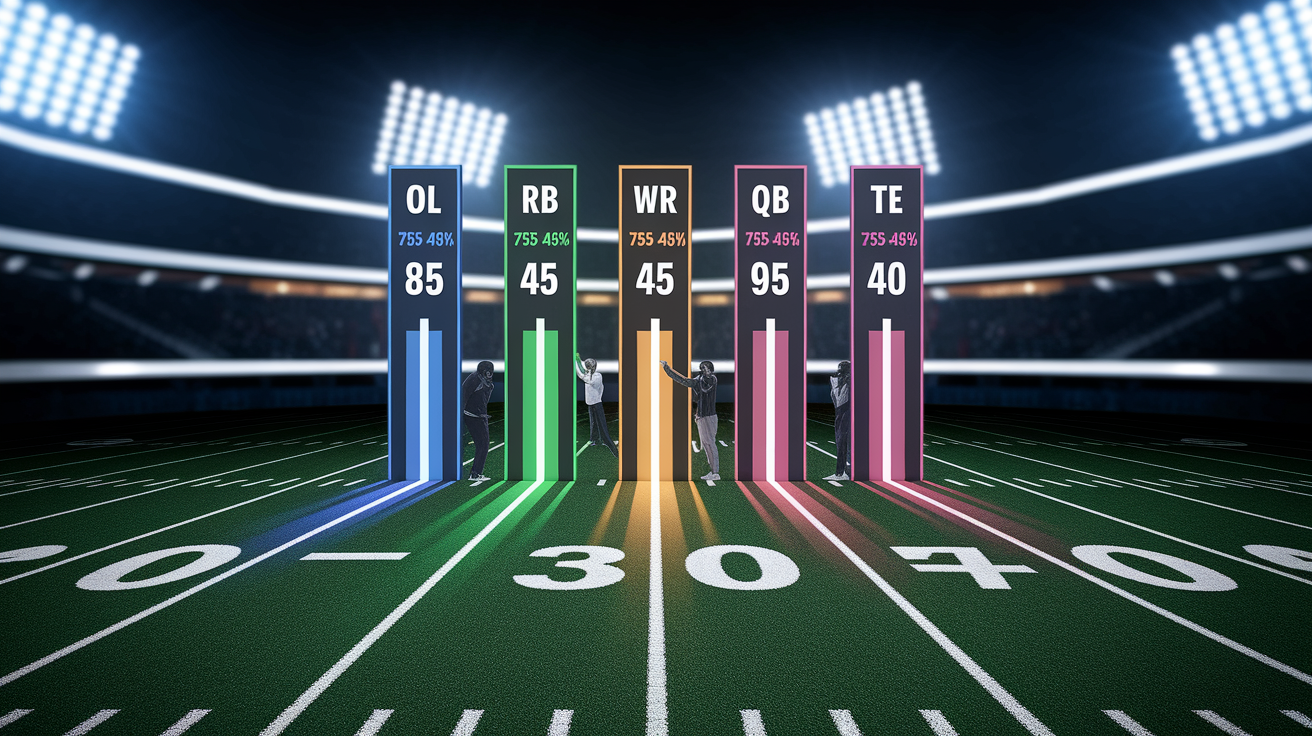
Position matters more than anything else once you’ve got the draft slot figured out. Offensive linemen taken in the first round log the highest rookie snap rates of any position, around 85% on average. They’re usually starting Week 1 no matter where in the round they went. Teams drafting O-line early almost always have immediate need or they’re planning succession, and either way the rookie’s on the field fast.
Running Back
First round running backs average about 52% of offensive snaps their rookie year, with around 15 percentage points of wiggle room. That spread comes from committee backfields and injuries more than how ready the guy is. Second rounders drop to 33%, third rounders settle near 24%. Rookie RB usage has actually slipped a bit since 2016, down roughly three points, as more teams split carries and lean on pass catching specialists instead of giving one guy everything.
Wide Receiver
Wide receiver’s the fastest integrating skill position. Round 1 guys average 58% of offensive snaps as rookies, and that number’s climbed about five points from 2018 to 2023. Spread offenses and high tempo passing make it easier. Round 2 receivers average 36%, Round 3 drops to 24%. Modern route trees and alignment flexibility let talented receivers contribute right away, especially in pass heavy schemes where there’s volume even for rotation guys.
Quarterback
Top 10 rookie quarterbacks who win the starting job log between 75% and 95% of offensive snaps, depending on injuries and bye weeks. Quarterbacks drafted after the first round hit a wall. Their rookie year start rate’s around 15 to 25%, and most log under 10% of team snaps unless someone gets hurt or benched mid season. The position’s learning curve and teams not wanting to throw unprepared passers into the fire creates extremes. High snap share for starters, almost nothing for backups.
Tight End and Offensive Line
First round tight ends average 45% of offensive snaps as rookies. Lower than skill positions because of blocking responsibilities, route complexity, and the fact that multi tight end packages split individual snap counts. Outside Round 1, rookie tight ends usually land between 12% and 25% depending on scheme and who’s already there. Offensive line expectations vary by spot. Interior guys and tackles drafted Round 1 both top 80% rookie snap rates when healthy. Later round linemen average 20 to 35% depending on injuries and depth chart luck.
Variables That Influence Rookie Snap Share

Draft capital sets the floor, but team specific stuff can shift outcomes by 20 to 40 percentage points in individual cases. If there’s a returning starter who logged more than 70% of snaps last season, that typically knocks 20 to 40 points off a rookie’s projection at the same spot. Coaching philosophy matters almost as much. Teams with head coaches who’ve historically started rookies at a rate above 40% add roughly 10 to 15 points to expected usage.
Offensive scheme complexity and tempo reshape things too. Teams in the top fifth of pass rate boost rookie wide receiver snap shares by five to 10 points on average. Power run schemes that lean on veteran blocking reliability cut rookie skill position usage by five to 15 points. Positional learning curves aren’t the same across the board either. Offensive linemen and running backs usually integrate faster than tight ends or quarterbacks, who face steeper mental and technical hurdles before coaches trust them in big moments.
Injuries are the wild card. A season ending injury to a starter during preseason can bump a rookie’s snap share up 30 to 60 points overnight. A rookie’s own injury can wipe projections off the board completely. Late summer roster moves or veteran signings mess with depth charts in ways historical averages can’t predict.
Key variables:
- Coaching tendencies – whether the coach has a history of starting or heavily rotating rookies in similar roles
- Incumbent depth – how many snaps the returning starter got last season
- Scheme fit – whether the rookie’s skill set matches what the offense actually does
- Offseason performance – preseason snap counts and first team reps in the final two exhibition games
- In-season injuries – both to the rookie and veterans at the same position
- Team competitiveness – playoff contenders lean on vets, rebuilding teams speed up rookie integration
Historical Trends in Rookie Snap Utilization

Rookie snap allocation’s changed noticeably over the past decade, though the draft slot correlation stays stable. Wide receivers and defensive backs have seen the biggest increases in rookie usage. First round receivers gained about four to six percentage points in average snap share from 2016 to 2023. That’s more about offensive philosophy than talent evaluation. Spread formations, no huddle tempo, empty backfield sets create more spots and reduce the learning curve for skilled route runners.
Running back and tight end rookie usage has stayed flat or dropped a little. Running backs lost roughly three points on average as veteran committees and pass catching specialists broke up traditional three down roles. Tight ends show steady rookie snap rates, but the position’s blocking duties and route complexity keep delaying full integration for most rookies outside the top 10 picks.
Defensive trends mirror the offensive changes. Cornerbacks and safeties drafted in the first two rounds now log higher rookie snap percentages than they did a decade ago. Sub package prevalence and the need for multiple coverage defenders in nickel and dime looks drove that. Linebacker rookie usage’s declined slightly as defenses shift toward lighter, faster personnel groupings that need veteran communication and assignment discipline more than raw rookie athleticism.
Draft Slot‑Based Projections for the Current Rookie Class

You can apply historical snap data and positional trends to the current rookie class and get usable projection ranges for fantasy, dynasty, and betting contexts. Top 10 picks at skill positions and offensive line should start with baseline snap expectations between 65% and 85%, then adjust for team depth and scheme. Mid first round picks (11 through 20) usually project to 55% to 70% snap shares. Late first rounders land between 45% and 60% depending on positional value and roster construction.
Second round picks get messier. Early Day 2 guys (picks 33 through 50) average around 30% to 40% rookie snaps for skill positions, with offensive linemen reaching 50% to 60% if they’re drafted into obvious need spots. Late second and third round picks cluster between 20% and 30%, often filling rotational or package roles instead of earning full time starting jobs. Day 3 picks outside the top 100 should be projected conservatively. Most will log under 15% of offensive snaps unless injury or veteran underperformance opens unexpected doors.
Confidence intervals stay wide even for high picks. A typical 95% projection range for a top five pick spans about 60% to 95% of snaps. That leaves room for both immediate All-Pro usage and moderate rotation due to scheme or injury. Mid round picks carry even bigger uncertainty. A second round wide receiver projected at 35% snaps could realistically finish anywhere from 10% to 65% depending on team context, preseason performance, and whether vets stay healthy.
Position specific adjustments tighten things up. Offensive linemen drafted Round 1 should add roughly eight percentage points to baseline slot projections. Quarterbacks who win the starting job add 15 to 20 points. Backup quarterbacks drop to near zero. Wide receivers on pass heavy offenses gain five to 10 points. Running backs on committee heavy rosters lose five. Tight ends and edge rushers usually track close to baseline unless scheme or injury creates something weird.
| Player | Draft Slot | Position | Projected Rookie Snap % | Confidence Level |
|---|---|---|---|---|
| Player A | 3 | WR | 82% (CI: 60–95%) | High |
| Player B | 7 | OT | 88% (CI: 72–98%) | High |
| Player C | 12 | QB | 85% (if starter; CI: 70–95%) | Medium (role-dependent) |
| Player D | 18 | RB | 60% (CI: 35–85%) | Medium |
| Player E | 28 | OL | 62% (CI: 44–80%) | Medium |
| Player F | 40 | WR | 37% (CI: 10–64%) | Low-Medium |
| Player G | 55 | TE | 28% (CI: 5–55%) | Low |
| Player H | 72 | RB | 24% (CI: 8–48%) | Low |
| Player I | 95 | WR | 18% (CI: 2–42%) | Very Low |
| Player J | 110 | CB | 14% (CI: 0–36%) | Very Low |
Final Words
The data shows a steady pattern: higher draft capital usually means more rookie snaps. We ran the numbers on draft-slot trends, broke down expectations by position, flagged the variables that change playing time, and put it into a few handy tables.
Use draft slot as your first filter, then adjust for scheme, depth chart, and injuries. Expect some surprises.
Treat these rookie season snap projections based on draft slot as a starting point, not a guarantee. They should help you spot value and enjoy following the season — it’s going to be fun.
FAQ
Q: What round is Skattebo projected to be drafted in?
A: Skattebo is projected to be drafted in the mid rounds, with most mock drafts placing him around rounds 3–4, though exact slot depends on evaluations and combine/workout results.
Q: Who are the best rookies to draft in 2026 for fantasy football?
A: The best 2026 rookie fantasy picks are early-round RBs and WRs with clear snap roles, plus QBs entering with starter certainty; prioritize draft slot, team need, and early opportunity.
Q: How much money will Cam Ward get?
A: Cam Ward will get an amount tied to his contract; no official figure is public yet, so watch team announcements and trusted salary trackers for the final terms.
Q: What is a good strategy for a snake draft?
A: A good snake-draft strategy is to take the best available early, balance RB/WR, target upside in mid rounds, handcuff top RBs, and maintain depth for byes and injuries.